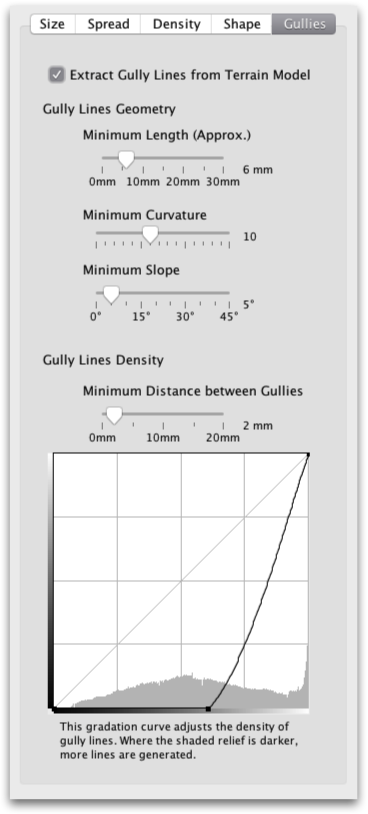
Gully Lines
These settings adjust the shape and density of gully lines.Gully lines are symbolized by scree stones placed along the line. Gully lines are an important element, as they are more effective at showing distinctive micro-valleys in a slope than contour lines, and they show the flowing character of scree.
The size of stones placed on gully lines can be adjusted in the Size panel.
Gully lines are extracted from the digital elevation model or can be loaded from an external file using the Input Data dialog. When loaded from an external file, only the first slider in this panel is enabled.
Use the Extract Gully Lines from Terrain Model check box to define whether gully lines are extracted from the terrain model.
Gully Lines Geometry
Minimum Length: This is the minimum length of each gully line. Scree Painter does not generate gully lines shorter than the value entered here.Minimum Curvature: This is the minimum curvature of a gully line. The curvature measures the concavity of the terrain. When extracting gully lines from a DEM, Scree Painter stops extracting when the line reaches an area with a curvature smaller than this value. The goal of this parameter is to ensure that gully lines are placed along concave gullies only and not on convex micro-ridges.
Minimum Slope: When extracting gully lines from a DEM, Scree Painter stops extracting when the line reaches an area flatter than this slope. The goal of this parameter is to avoid gully lines in flat areas.
Gully Lines Density
Minimum Distance between Gullies: This parameter avoids gully lines lying very close to each other.Gradation Curve: Where the shaded relief is dark, more gully lines are generated. The gradation curve is applied to the shaded relief and thereby adjust the density of gully lines. If the curve is moved upwards, less gully lines are extracted. The histogram of the shaded relief is displayed at the bottom of the curves. To adjust the curve, click to add a point and click and move to displace a point. To fine-tune the curve, move the mouse curser over the map. A darker vertical line in the histogram indicates the gray value at the current mouse position.

